Jabil's 2023 Sustainability Report
At Jabil, we strive to make anything possible and everything better. This mission drives our goals and activities supporting a comprehensive sustainability strategy. We invite you to learn more about the programs that Jabil supports for our employees, customers, and local communities around the world.
At Jabil, we strive to make anything possible and everything better. This mission drives our goals and activities supporting a comprehensive sustainability strategy. We invite you to learn more about the programs that Jabil supports for our employees, customers, and local communities around the world.
TO OUR EMPLOYEES, CUSTOMERS, INVESTORS, AND OTHER STAKEHOLDERS
At Jabil, sustainability is the integration of environmental health, social equity, governance and economic growth to create thriving, healthy, diverse and resilient business operations for our employees and the communities in which we live and work...for this generation and generations to come.
We understand our responsibility to be good stewards of natural resources and positively contribute to global environmental and social challenges. We listened to our stakeholders and developed our strategy and goals in alignment with the social and environmental challenges they care about most, and the areas we believe we can make the biggest impact.
We have established three pillars that form the foundation for our global sustainability efforts:
OUR SUSTAINABILITY PILLARS
OUR
People & Communities
Focusing on the health and well-being of our people and the communities in which we operate.
Learn more
OUR
Operations & Resources
OUR
Innovative Solutions
OUR
AWARDS & RECOGNITIONS
- The World's Best Companies | TIME & Statista
- Fortune 2024 World's Most Admired CompaniesTM
- America's Most Responsible Companies | Newsweek & Statista
- Best Place to Work for Disability Inclusion by Disability:IN (2021-2023)
- America's Greatest Workplaces for Diversity 2023 | Newsweek
- Diversity Leaders 2023 (Europe) | Financial Times & Statista
- 2023 Asia Award Winner | Renewable Energy MarketsTM
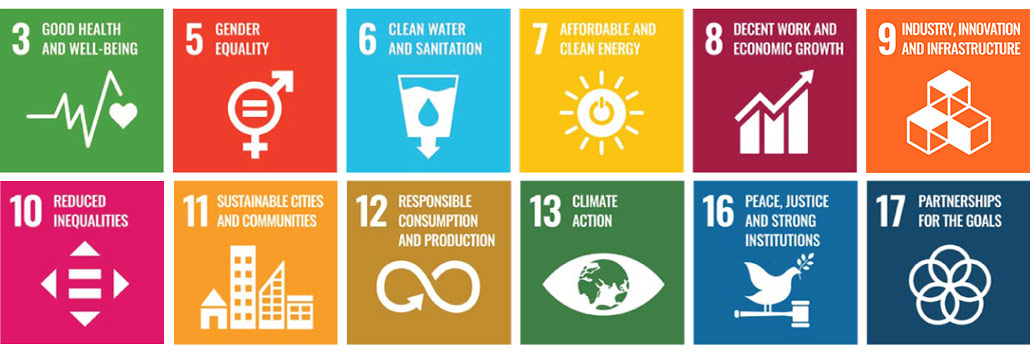
OUR
SDG CONTRIBUTION
We contribute to the achievement of the
following UN Sustainable Development Goals:
SUSTAINABILITY REPORT

SUSTAINABILITY REPORT
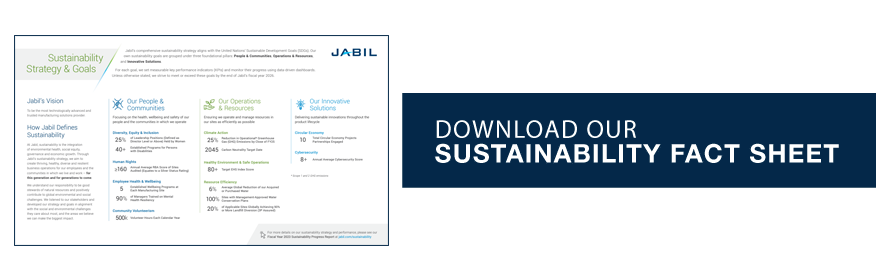
Download our fiscal year 2023 Sustainability Progress Report to learn more about Jabil’s sustainability commitments, progress, and reporting. The report includes updates aligned to the Global Reporting Initiative (GRI), Sustainable Accounting Standards Board (SASB), and Task Force on Climate-Related Financial Disclosures (TCFD). To ensure accurate reporting, the data within these reports are validated internally and by external third parties.
The report shows how we:
- Continued our transition to full use of renewable energy by signing Power Purchase Agreements with suppliers in Latin America and Europe
- Reduced Scope 1 & 2 emissions by 29% (vs. FY19)
- Contributed more than one million hours of volunteer service around the world
OUR FIVE-YEAR GOALS
DRIVING MEANINGFUL ACTION
Jabil's sustainability goals fall under three foundational pillars: Our People & Communities, Our Operations & Resources, and Our Innovative Solutions.
For each goal, we set measurable KPIs and monitor their progress using data-driven dashboards. Thanks to the hard work and innovation from our employees, we are on track to meet or exceed each of our goals by the end of Jabil’s fiscal year 2026.
“Our sustainability goals are intrinsically tied with those of our customers, many of whom are the world's leading brands. In recognition of this shared objective, an integral part of our mission is to partner with and offer them our support as they strive to achieve their own sustainability goals.”
– Kenny Wilson, CEO
OUR
People & Communities
DIVERSITY, EQUITY & INCLUSION
25%OF LEADERSHIP POSITIONS HELD BY WOMEN |
40+ESTABLISHED PROGRAMS FOR PERSONS WITH DISABILITIES |
EMPLOYEE HEALTH & WELL-BEING
5ESTABLISHED |
90%OF MANAGERS TRAINED ON MENTAL HEALTH RESILIENCY |
HUMAN RIGHTS
≥160ANNUAL GLOBAL SITE AVERAGE RBA SCORE THAT EQUATES TO A SILVER STATUS RATING |
OUR
Operations & Resources
CLIMATE ACTION
25%REDUCTION IN OPERATIONAL |
50%REDUCTION IN OPERATIONAL |
2045CARBON NEUTRALITY TARGET DATE |
|
HEALTHY ENVIRONMENT & SAFE OPERATIONS
80+TARGET EHS INDEX SCORE |
RESOURCE EFFICIENCY
6%AVERAGE GLOBAL REDUCTION OF OUR ACQUIRED OR PURCHASED WATER |
|
|
30% OF APPLICABLE SITES GLOBALLY ACHIEVE 90% OR MORE LANDFILL DIVERSION |
*Scope 1 and scope 2 GHG emissions
OUR
Innovative Solutions
CIRCULAR ECONOMY
10TOTAL CIRCULAR ECONOMY PROJECTS ENGAGED |
CYBERSECURITY
8+ACHIEVEMENT OF ANNUAL AVERAGE CYBERSECURITY SCORE |